Backsphere
Menu
  • Home
  • About
  • Contact
Press enter to begin your search
Close Search

Geographical Chart

  • September 19, 2011

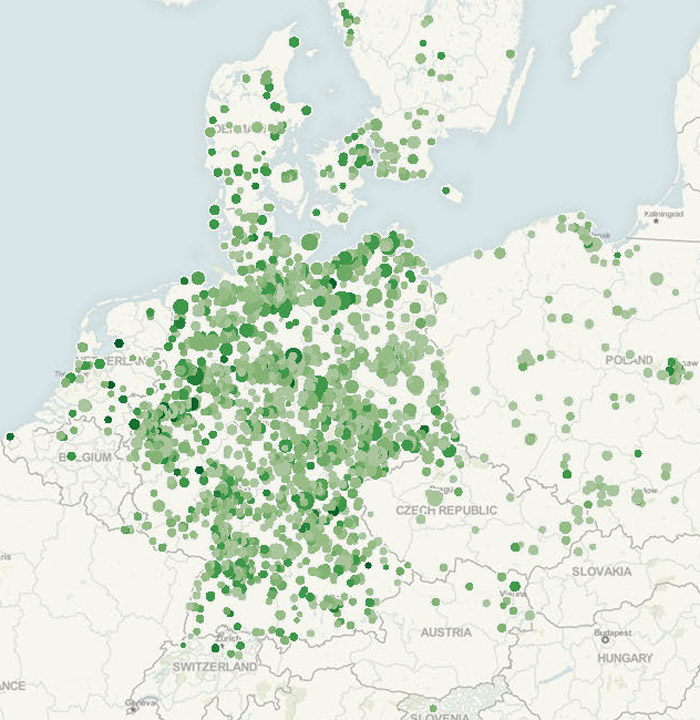
Two key parameters charted on Europe map visualised in color intensity and size. The data feeds itself from an Excel file, where updated data is manually keyed in.

  • Previous ProjectDashboard

  • Next ProjectSWOT Controlling

Share Share Share Pin

Quick Access

  • Home
  • About
  • Contact

Get in touch

Pestalozzistrasse
Berlin

E: sven@backsphere.com

Blogroll

  • Hichert
  • Information Management
  • Juice Analytics
  • Perceptual Edge
  • Tableau Software
  • twitter
  • linkedin

© 2025 Backsphere.

Close Menu
  • Home
  • About
  • Contact
Menu