In my profession as management accountant I stumbled across a software called “Tableau” a few years ago. It since has evolved to version 6 and has undergone careful extension.
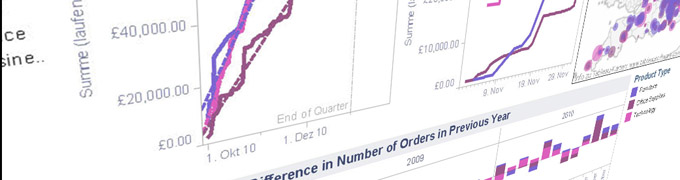
I like its simple and clean interface and the fact that it does NOT try to present everything glossy and bold – quite unusual for our friends from overseas. Its characterised by a spreadsheet-type view which goes beyond the usual cross-tables and pivot presentation. This is achieved by switching to a graphical view whenever new dimensions are pulled into the window. It is surprisingly precise in choosing the right visualisation depending on what data you are including in your analysis. By doing so, Tableau leads you very quickly to the patterns and outliers in your data. A few examples:


Filters are implemented nicely as well as they allow you to narrow down your analysis without the use of pop-up windows. The filters can be checkboxes but also sliders for ranges and have an immediate effect on your visualisation.
Furthermore, it is possible to plot data on maps. You can either use coordinates or zip codes. These also work for countries other than the US. In each analysis you can graphically select items, exclude them or continue working only with that selection. This functionality allows for quick “cleaning” of data which otherwise might distort the analysis. By offering this functionality Tableau allows for analysis which does not stop after the first step but instead allows for further analysis which often becomes necessary as the first step triggers additional questions.
Trend lines are also supported which are especially usefil with Scatterplots in order to spot the direction and strenght of a trend more easily. Of course this is updated after any change immediately.
What I found to be very useful is the solution to a common problem: You have a scatterplot indicating several dimensions in one graph but you would like to see the trend over time. Tableau offers a function which allows you to “scroll” through time (or any other dimension) so that the chart updated while you scroll. Quite clever and subtle -no flashy 3D circulating objects but straight information.
Tableau is able to access a wide range of datasoures such as all major SQL- and OLAP databases, Excel- and textfiles. You can also build simple JOINS even with text files. Based on my experience over the last years the vendor is carefully developing the product, concentrates on the most important and not all features and makes sure it actually works. Unfortunately, this is not always the case nowadays. If you are experiencing trouble with your current BI-solution, give it a try. They offer a 30-day evaluation (Tableau Website).
Recent Comments